|
|
Application module:
Function based behaviour |
ISO/TS 10303-1453:2014-02(E)
© ISO
|
Annex F
(informative)
Application module implementation and usage guide
Function Based Behaviour clearly depicts functions and their I/O. It is hierarchical. Ordering
of the functions is provided by ordering operations. Functions with their I/O correspond to classic
systems engineering N-squared charts and related to (but not identical with) data flow diagrams. They
provide a functional data model. Functions with their ordering correspond to the Functional Flow
Block Diagrams (FFBD's), developed in the 1950’s by TRW for the Army ballistic missile program. They modelled
functional control. In the 1970’s, when Jim Long added I/O to the FFBD’s, these executable diagrams
began to be used in systems engineering to capture response to excitation and to generate time lines.
They have been called Behaviour Diagrams (BD's) and Extended Functional Flow Block Diagrams (EFFBD’s).
During 2006 the SysML program http://www.omgsysml.org has generated a standard that provides
for an equivalent capability with diagrams called Activity Diagrams; reference
http://en.wikipedia.org/wiki/Activity_diagram.
These are extensions made to UML 2.0 (see, http://en.wikipedia.org/wiki/Unified_Modeling_Language)
via the SysML program (see, http://en.wikipedia.org/wiki/SysML).
It is possible to define a unifying view for all of these graphical presentation.
This is capsulated both in the AP233 Concept Model and in Jim Long's white paper Relationships
between Common Graphical Representations in Systems Engineering.
F.1 AP233 function based behaviour concept model
Function Based Behaviour can be defined as a representation of what a system is to do,
based on descriptions of the transformations it performs. What a thing does can be
described by citing a set of significant transformations it performs. In science and
all changes can be represented by transformations that follow well known transformation
laws like conservation of matter and energy.
Function is a transformation that consumes engineering things and generates or transforms
them into other engineering things. I/O is the output from one Function and the input to another Function.
In all of the mathematical laws of science engineering things are transformed into other
engineering things.
In the physical world nothing is created, destroyed or deleted. There is only transformation.
Function embodies this concept and is the representation and basis for change in the physical world.
Figure F-1 — Definitions concerning function based behaviour
Figure F-1
and the integer tagged definitions below provide the relationships for Function, I/O and Ordering
that are essential to the function based behaviour representation problem.
An engineering thing is that for which observable, measurable, and reproducible properties or
attributes can be obtained.
Function (31) is a transformation that consumes one set of engineering things and generates or
transforms them into another set of engineering things.
I/O (32) is the output from one Function and an input to another Function
Time_interval (36) is a period of time during which a Function produces its I/O. In some disciplines
the transitions are found to be fast enough that they can be considered to be instantaneous.
Transformation of inputs into outputs takes a finite amount of time. The Time_intervals can be
assigned to a complex set of functions and then the time line for the behaviour can be calculated
from the model. In this manner an overall required time response can be calculated from a
design behaviour model. That prediction can then be verified by measurement when the system is built.
Function_ordering (37) is an operator that arranges functions as they are to be
executed in practice. Functions may occur in sequence or concurrently. It is possible to execute a
function repeatedly. These relationships are captured by a set of ordering operations and a set of
execution rules for the model.
Script (38) is a set of language elements associated with a Function that define how that Function
acts on inputs to generate outputs. By embedding language elements in a Function, the Function
can carry out transformation and decision processes on inputs that it receives.
Sequence (39) is an ordering operator that establishes sequence among Functions. In some cases a
behaviour requires a particular sequence of Functions to get a particular result.
And (40) is an ordering operator that establishes concurrency among functions. Some Functions must
be done at the same time to be effective; they must be concurrent.
Or (41) is an ordering operator that establishes alternative paths among a group of Functions. In
many systems there are multiple choices in its behaviour. These choices are represented by
multiple paths or threads through the behaviour.
Multi_exit_function (42) is a Function that acts as an ordering operator that provides multiple
exits to alternative paths. One way of representing alternative paths is to use a Function that
has multiple exits and internal rules for the choices.
Loop(43) is an ordering operator that repeats a Functions or group of Functions some number of times.
Often the same transformation is repeated for some number of times.
Loop_limit (44) is the number or expression for the number of repetitions in a Loop. It is inefficient
use of resource to allow a loop to run without a limit to stop it.
Loop_exit (45) is the ordering operation that terminates a loop and provides correct continuation of
the execution path. Often when a loop ends there is a transition to an entry point in the behaviour.
Iterate (46) is an ordering operator that repeats a Function or group of Functions. It is possible for
the termination of a repeated transformation not to be based on a number. It may be based on a
condition or a set of conditions.
Iterate_limit (47) is an ordering operation that establishes the set over which the iteration is
to be performed. In the games of checkers and chess there is no set number of moves that are made.
Rather the game proceeds by a set rules until a final rule or condition is met.
F.2 Background
The following text has been extracted (with permission) from Jim Long's White Paper "Relationships
between Common Graphical Representations in Systems Engineering". This work is harmonized with
both the AP233 Concept Model and the EXPRESS model defined within the Function Based behaviour
module set. The full/original white paper entitiled can be downloaded at:
http://www.vitechcorp.com/library/papers.php
Over the past several years, systems engineers have
evolved to a few graphical representations to present the functional and data flow
characteristics of their system design. The most common of these are the Function Flow
Block Diagram (FFBD),Data Flow Diagram (DFD), N2 (N-Squared) Chart, IDEF0 Diagram,
Use Case, Sequence Diagram, Enhanced Function Flow Block Diagram, and behaviour Diagram (BD).
Most of these graphical representations allow the engineer to decompose the functional
and/or data models hierarchically.
The objective of AP233's Function based behaviour capability is to provide a data model that
can be used as a neutral format for all of the graphical representations defined herein.
This data model is "complete", relative to the function based behaviour representation
needs of systems engineering.
F.3 Terminology
Let us introduce two terms that we use in describing the conditions that allow/cause a
function to begin execution. Considering the control and data environment, a function can
begin execution if it is both enabled (by control) and triggered (by data). In the case where
there is no data trigger specified, a function begins execution upon being enabled. A
function is enabled if the function(s) that precede it in the control flow specification
have completed execution (e.g., satisfied their completion criteria). A function is triggered
when the required stimulus data item becomes available to the function. We are not concerned
here with other execution requirements (such as the availability of necessary resources, except
in the case of the Dynamic Timeline Diagrams) that could be represented by either control or
data structures as necessary.
F.3.1 Function Flow Block Diagram
The Function Flow Block Diagram (FFBD) was the first to be favored by systems engineers and
continues to be widely used today (DSMC 1989, Blanchard and Fabrycky 1990 book "Systems
Engineering and Analysis").
Figure F.2
shows a sample FFBD. An FFBD shows the functions that a
system is to perform and the order in which they are to be enabled (and performed). The order
of performance is specified from the set of available control constructs shown in
Figure F.3 . The
control enablement of the first function is shown by the reference node(s) which precede it,
and the reference node(s) at the end of the function logic indicate what functions are enabled next.
The FFBD also shows completion criterion for functions as needed for specification (for example,
the exits for the multi-exit function in Figure 1). The FFBD does not contain any information relating
to the flow of data between functions, and therefore does not represent any data triggering of
functions. The FFBD only presents the control sequencing for the functions.
Figure F.2 — Sample Function Flow Block Diagram (FFBD)
Figure F.3 — Control Constructs for Function Flow Block Diagrams
F.3.2 Data Flow Diagram
The Data Flow Diagram (DFD), shown in
Figure F.4,
shows required data flow between the functions of
a system (DeMarco 1979). This representation has been widely used by software engineers and serves
as the basis of many software engineering methodologies and automated tools. The figure shows that
data repositories, external sources, and external sinks can also be represented by DFDs. However,
DFDs do not show any control constructs for function sequencing or enablement.
Figure F.4 — Sample Data Flow Diagram
F.3.3 N-Squared (N2) Chart
The N-Squared (N2) Chart, shown in
Figure F.5,
was developed to show and specify interfaces
between the elements of a system (Long et al. 1968, Lano 1977).
Figure F.5
is the N2 Chart that
corresponds to the Enhanced FFBD in
Figure F.7.
When used to show the interfaces between the
functions in a system, the N2 chart is equivalent to a DFD - it contains all the information and
differs only in format. The N2 chart is commonly used as a complement to the FFBD to provide the
data flow information as inputs and outputs of the system functions.
Figure F.5 — Sample N-squared (N2) Chart
The N2 Chart is structured by locating the functions on the diagonal, resulting in an N squared matrix
for a set of N functions. For a given function, all outputs are located in the row of that function
and all inputs are in the column of the function. If the functions are placed on the diagonal in
the nominal order of execution, then data items located above the diagonal represent normal flowdown
of data. Data items below the diagonal represent data item feedback. External inputs can optionally
be shown in the row above the first function on the diagonal, and external outputs can be shown in
the right-hand column. If desired, data repositories can be represented by placing them on the diagonal
with the functions.
F.3.4 IDEF0 Diagram
The IDEF0 Diagram (see
Figure F.6)
appears to be a derivative of the DFD with a format like the
N2 Chart (Groveston, 1989 and FIPS-183, 1993). The primary content of the IDEF0 Diagram is the
specification of data flow between system functions. An IDEF0 diagram is often supported by an
IDEF1 or IDEF1x diagram indicating data keys with the objective of preserving referential integrity.
The IDEF0 diagram does allow the specification of control as an input to a function but does not have
the capability to characterize that control in terms of constructs, as the FFBD, EFFBD, and behaviour
Diagrams do. The specification of control with the IDEF0 notation is incomplete and, therefore, not
executable. The IDEF0 Diagram also represents the mechanism (usually the component to which the
function is allocated) which performs the function.
Figure F.6
is the IDEF0 Diagram that corresponds
to the EFFBD in
Figure F.7.
Figure F.6 — Sample IDEF0 Diagram
F.3.5 Enhanced FFBD
The EFFBD displays the control dimension of the functional model in an FFBD format with a data
flow overlay to effectively capture data dependencies. Thus, the Enhanced FFBD represents:
(1) functions, (2) control flows, and (3) data flows. The logic constructs allow you to indicate
the control structure and sequencing relationships of all functions accomplished by the system being
analyzed and specified. When displaying the data flow as an overlay on the control flow, the EFFBD
graphically distinguishes between triggering and non-triggering data inputs. Triggering data is
required before a function can begin execution. Therefore, triggers are actually data items with
control implications.
In Figure F.7,
triggers are shown with green backgrounds and with the
double-headed arrows. Non-triggering data inputs are shown with gray backgrounds and with
single-headed arrows.
Figure F.7 — Sample Enhanced FFBD
The Enhanced FFBD specification of a system is complete enough that it is executable as a
discrete event model, providing the capability of dynamic, as well as static, validation. A
fundamental rule in the interpretation of an EFFBD specification is that a function must be
enabled (by completion of the function(s) preceding it in the control construct) and triggered
(if any data input to it is identified as a trigger) before it can execute. This allows the
engineer maximum freedom to use either control constructs or data triggers (or a combination
of both) to specify execution conditions for individual system functions. By augmenting the EFFBD
with function duration estimates/budgets and resource constraints and utilization, trade studies
can be done using dynamic simulation outputs.
Figure F.8
shows the output of such a simulation.
This figure shows timelines for a resource (MIPS). It also shows timelines for the integrated
system functions, indicating the delays in function execution due to waiting for triggers and
resources (MIPS). This dynamic view is also capable of showing the status of the queuing of
triggering data.
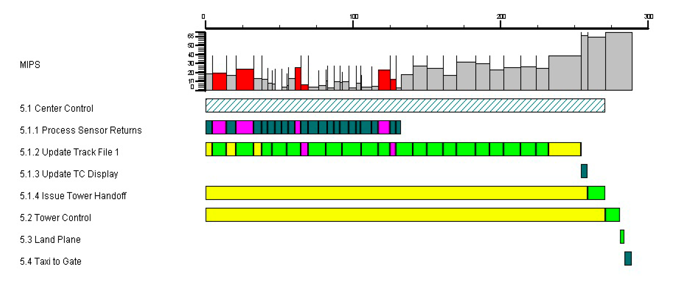
Figure F.8 — Dynamic Timeline
F.3.6 Behaviour Diagram (BD)
The behaviour Diagram (BD)
(Figure F.9)
is a graphical representation equivalent to the
Enhanced FFBD
(Figure F.7).
The primary difference is in the orientation of the control flow:
in the EFFBD, control sequencing is from left to right; in the BD, control sequencing is
from top to bottom. While it is not shown on the graphical construct, the BD model allows
data inputs to a function to be characterized as either triggering (a control capability)
or data update (not a control implementation).
Figure F.9 — Sample Behaviour Diagram
As with the Enhanced FFBD, the behaviour Diagram specification of a system is sufficient
to form an executable model allowing dynamic validation via discrete event simulation methods.
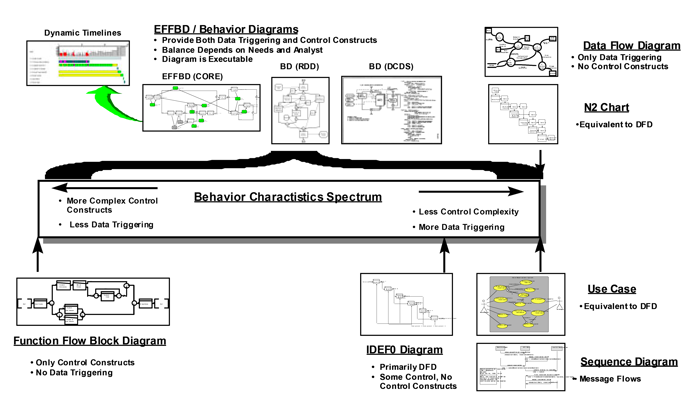
F.4 Relationships between the diagrams
From the descriptions of the graphic representations, it is seen that the FFBD
characterizes only the functional control model and the DFD characterizes only the
functional data model for a system. The Enhanced FFBD and behaviour Diagram capture both
these limiting models and the continuum between them.
Figure F.10
shows where all these
graphical representations fit on the behaviour spectrum and, therefore, places them in
perspective relative to each other in the sense of specifying control and triggering
for functions.
Figure F.10 — Relationships of All Graphical Representations - FFBD and DFDs Are Limiting Cases
F.5 Conclusions
The graphical representations that systems engineers commonly use to describe and
specify the functionality and data requirements of a system are very closely related
when analyzed in the context of data and functional control capabilities. In particular,
the FFBD and DFD are limiting cases of the EFFBD/behaviour Diagram representation
The N2 Chart is equivalent to the DFD: so it is, likewise, a limiting case of the EFFBD/BD
on the data modeling end of the spectrum. The IDEF0 is essentially a DFD, except that some
control capability (no control constructs) is added. The IDEF0 also allows the explicit
representation of functional allocation (i.e., what system component performs each function).
© ISO 2014 — All rights reserved